
THE EXECUTIVE VIEW
Three takeaways
Over five years, modelled expenditure is $1.77m for Build, $1.20m for Configure and $0.340m for Consume, assuming a seven-week Consume implementation midpoint.
Compared with self-build, Consume releases $1.43m of five-year cash expenditure for other uses before reinvestment earnings. The three-scenario average cumulative advantage is $1.64m.
Close tailoring can favour Build or Configure; standardised Consume can reduce delivery effort and make routine operational pricing predictable. Actual suitability, contractual exit, vendor reliance and benefit delivery must be assessed case by case.
Publisher disclosure
Monetary values are US dollars in millions, shown to three significant figures with $ and m in each monetary table cell. Calculations use unrounded inputs; displayed totals may not reconcile exactly. Percentages, years and staffing allocations retain their own units.
Invenire Risk supplies Sapere and therefore has a commercial interest in GRC technology adoption. This report presents an illustrative decision framework, not an independent product ranking. Its financial assumptions are not quotations for Sapere or any other named provider.
Executive summary
Choosing governance, risk and compliance technology is a decision about more than software expenditure. It also determines how an organisation commits its people, when it starts receiving benefits and how much capital remains available for other priorities.
This report examines three distinct ways to obtain the same required governance, risk and compliance capability:
• Build — develop and operate a bespoke system internally. The firm controls its own architecture and product roadmap but must fund engineering, testing, infrastructure, support and future change.
• Configure — license a commercial platform and tailor its workflows, controls, integrations or reporting to the firm. The vendor provides a core product, while customer-specific implementation and retained specialist administration remain material.
• Consume — subscribe to a largely standardised, vendor-operated service that can be deployed with limited configuration. The supplier maintains the platform, while the firm retains accountability for its own risk and decisions.
In the illustrative wage-based reference case, five-year included expenditure is $1.77m for Build, $1.20m for Configure and $0.340m for Consume. The illustrative buyer has 500–2,500 employees. These figures are planning assumptions, not matched vendor quotations or observed cohort averages. Developer and QA employer on-costs are not included in the headline wage-based case.
Build is the baseline. For each year, savings are calculated as the cost of Build minus the cost of the alternative in that same year. Over five years, Configure avoids $0.573m and Consume avoids $1.43m in expenditure before reinvestment. Build has zero savings against itself.
The equally weighted average cumulative advantage across the illustrative 2%, 5% and 8% reinvestment scenarios is $0.676m for Configure and $1.64m for Consume at Year 5. At Year 15, the respective amounts are $1.41m and $4.94m. These are cash savings plus compounded earnings, not standalone GRC profits or probability-weighted forecasts.
The distinction is important. With an assumed mature annual GRC cash benefit of $0.150m, Consume reaches a positive five-year NPV of $0.304m in this illustrative case and first achieves discounted payback at Year 1. This relies on the assumed seven-week go-live and benefit realisation; it is not an evidenced customer result. Build and Configure still have negative five-year NPVs in the base case.
1. Three approaches, different responsibilities
For this report, the three approaches are defined as follows.
| Approach | What the organisation obtains | What it continues to own |
|---|---|---|
| Build | A bespoke system developed for its requirements | Product design, engineering, testing, hosting, security, maintenance and future development |
| Configure | A commercial platform adapted to its processes | Implementation, configuration, integrations, administration and the responsibilities specified in its hosting and support arrangements |
| Consume | Access to a vendor-operated platform through a subscription | Business ownership, data quality, role and access decisions, process adoption and supplier oversight (without a separately modelled vendor-side administration charge) |
These are delivery and commercial choices, not rigid product categories. A SaaS platform can require substantial configuration. A configured product can be vendor-hosted. An internal build can depend heavily on external infrastructure and software libraries.
For calculation purposes, Configure is a materially tailored enterprise subscription and Consume is a more standardised vendor-operated service. Both include vendor-managed hosting and standard maintenance within the subscription. They differ principally in the extent of customer-specific implementation, specialist retained work and the opportunities to use standard platform capabilities.
The analysis considers a hypothetical mid-market organisation obtaining GRC technology for its own use. It does not evaluate a software vendor developing a product to sell to multiple customers.
Qualitative trade-offs: tailoring, predictability and exit
Build can deliver the closest fit where the organisation has unusual processes, deep engineering expertise or a strategic need to own source code and roadmap decisions. The corresponding trade-off is continuing responsibility for architectural integrity, cyber security, maintenance, staffing resilience and upgrades.
Configure may offer more tailored workflows and integrations than a standardised service while benefiting from a vendor-maintained core product. That flexibility can be valuable for complex entities or established technology estates, but client-specific dependencies can increase the cost of changes, testing and future migration.
Consume prioritises faster availability, a relatively predictable subscription and standard vendor-led updates. Where processes fit the product, switching or exiting may involve less technology retirement than an internally built system, but this is not guaranteed: data portability, contract terms, integrations, implementation dependencies and any migration effort must still be assessed.
Establish the common requirement first
A meaningful comparison needs an agreed scope: the workflows, users, entities, integrations, reporting, evidence retention, access controls, availability and support arrangements each option must provide.
A lower-cost proposal is not equivalent if it omits a required capability. Conversely, paying for functionality that the organisation does not need should not be mistaken for obtaining greater value.
2. Cost assumptions: distinguish evidence from judgement
Labour benchmarks
The reference case uses the US Bureau of Labor Statistics’ May 2025 all-industry national mean annual wages:
| Occupation | Annual mean wage |
|---|---|
| Software developers | $0.148m |
| Software quality assurance analysts and testers | $0.111m |
These are published occupational averages, not seniority-specific salaries or quotations for a particular hiring location. The full-precision wage observations are retained in the calculation model; only presentation is rounded. [1]
BLS wage estimates exclude employer costs of nonwage benefits and nonproduction bonuses. They should therefore not be presented as the complete cost of employing a developer or QA specialist. [2]
The model uses these wage observations unchanged. It does not apply an assumed adjustment from May 2025 to October 2026. All subsequent projections hold the model’s dollar inputs constant rather than adding annual inflation.
Staffing and delivery assumptions
The resource plan retains the reviewed model’s existing assumptions:
| Stage | Build resource allocation |
|---|---|
| Delivery: first 18 months | Three developers, half of a full-time QA role and half of a full-time project-management role |
| Support: from month 19 | One developer, one-quarter of a QA role and one-quarter of a Product Owner role |
The project-manager allowance remains $0.180m per full-time year, and the Product Owner allowance is $0.140m per full-time year. Both are illustrative role-cost allowances rather than verified pay benchmarks. The Product Owner replaces the previously labelled technical administration role without changing the Build staffing cost. The staffing quantities and skills mix also require validation against a real implementation.
The illustrative delivery periods are 18 months for Build and nine months for Configure. Consume is assumed to go live in six to eight weeks, modelled at a seven-week midpoint. That accelerated schedule depends on scope fit, prompt access to agreed requirements, timely decisions and no external delays; complex migration or integration work would lengthen delivery.
Commercial and infrastructure assumptions
| Included cost | Build | Configure | Consume |
|---|---|---|---|
| Annual software subscription | Not separately modelled | $0.150m | $0.0600m |
| Initial implementation or onboarding | Included in delivery staffing | $0.150m | $0.0400m |
| Initial infrastructure | $0.0500m | Included in subscription assumption | Included in subscription assumption |
| Annual infrastructure | $0.0200m | Included in subscription assumption | Included in subscription assumption |
| Annual retained platform administration | Included in support staffing | $0.0600m | No additional charge assumed |
The central annual subscription assumptions are $0.150m for Configure and $0.0600m for Consume, reflecting different levels of tailoring and retained operating effort. Sensitivities test $0.0800m–$0.200m for Configure and $0.0500m–$0.100m for Consume. The ranges overlap: a configurable solution need not be more expensive than every consumed solution. User entitlements, complexity, negotiated terms, module scope and support requirements can materially change pricing.
Supplier pricing structures distinguish software entitlements from implementation and optional services. The research discussion supporting these ranges identified lower-priced cross-functional deployments as well as more substantial enterprise purchases; it did not establish one universal starting price. [11] [12]
Configure implementation is modelled at $0.150m, deliberately a relatively restrained starting allowance rather than a typical enterprise quote. The actual cost can be below or substantially above it depending on entity structure, user population, required workflows, integrations, testing, migration, reliance on supplier resources, service arrangements and the extent of bespoke configuration. For Build, costs depend heavily on internal skills, requirements quality, governance and change processes, chosen infrastructure, supported software, architecture and technical complexity. The $0.0500m initial and $0.0200m annual infrastructure allowances are unverified. Both approaches require an organisation-specific estimate.
Both commercial cases incur their full annual software subscription from Year 1. Configure retains a provisional $0.0600m annual platform administration allowance; Consume has no separately budgeted recurring administration charge, as routine vendor-side operations, software upkeep and technical support are assumed to be included in its $0.0600m subscription. Client accountability for risk decisions, access permissions, data and supplier oversight remains and is not eliminated by this pricing assumption.
Employer-cost sensitivity
To avoid replacing one unsupported loaded-cost figure with another, the main calculation uses the agreed developer and QA wages without an additional employer-cost percentage.
The following sensitivities show the effect of adding illustrative on-costs to those two wage categories only:
| Additional developer and QA employer costs | Five-year Build expenditure |
|---|---|
| Not included: wage-based reference case | $1.77m |
| 20% illustrative addition | $2.05m |
| 30% illustrative addition | $2.18m |
The headline figures should therefore be read as an included-cost comparison—not a complete, fully loaded procurement budget.
3. What counts as a GRC benefit?
The model assumes a mature annual benefit of $0.150m for each option, introduced after its assumed delivery period.
This represents realised cash savings or evidenced avoided committed expenditure compared with the organisation’s existing arrangements. It is an assumption requiring a supporting benefits assessment, not a measured customer outcome.
Possible examples include retiring a paid legacy service, reducing external processing expenditure or avoiding an otherwise approved recruitment requirement.
Released staff time is different. It may be valuable, but it does not automatically reduce payroll. Its financial value should be established through the additional work it enables or the expenditure it demonstrably avoids.
The model does not assign a cash benefit to avoided fines, improved reputation, intellectual-property ownership or unquantified reductions in operational losses. Nor does it count avoided vendor licence fees as an additional Build benefit: those differences are already reflected in the cost comparison.
Benefit timing
| Option | Year 1 benefit | Year 2 benefit | Each full year thereafter |
|---|---|---|---|
| Build | $0.000m | $0.0750m | $0.150m |
| Configure | $0.0375m | $0.150m | $0.150m |
| Consume | $0.130m | $0.150m | $0.150m |
The benefit phasing assumes Build becomes operational after 18 months, Configure after nine months and Consume after seven weeks (the midpoint of the indicative six-to-eight-week range). For Consume, Year 1 includes 45 of 52 weeks of the assumed annual benefit, with subsequent full years at $0.150m. This assumes prompt availability of all prerequisites and proportionate benefit realisation after go-live; slower adoption would reduce first-year benefits.
In an actual business case, a slower adoption curve could materially reduce early benefits.
4. Reading the financial measures
The measures answer different questions and should not be used interchangeably.
| Measure | Meaning in plain English | How to interpret it |
|---|---|---|
| Modelled expenditure | The included costs added over the selected period | Lower is better, provided scope and outcomes are comparable |
| Cash benefit | Savings or avoided commitments before deducting project costs | Higher is better, where supported and achievable |
| Simple ROI | Total benefits minus total costs, divided by total costs | Higher is better. Zero means included costs have been recovered |
| Net present value: NPV | Benefits minus costs after translating future amounts into today’s value | Higher is better. A negative value remains a shortfall, even if it is less negative than another option |
| Discounted payback | The first modelled year-end when accumulated discounted benefits cover accumulated discounted costs | Earlier is better for recovery speed |
| Reinvestment return | The assumed annual return earned on capital available for other uses | Higher produces more growth, but is not evidence of lower risk or a better investment |
| Retained-capital advantage | The additional funds remaining under one choice, including assumed investment growth | Higher favours the first-named option. It is not standalone GRC profit |
The model retains an 8% real discount-rate assumption for NPV. “Real” means after inflation. It is a modelling input, not a recommendation for every organisation’s required return.
A five-year simple ROI of 20% means total benefits are 1.20 times total included costs over five years. It would not mean a 20% return each year.
Five-year reference results
Calculated from the disclosed inputs. Lower included cost and higher ROI/NPV are preferable when scope is equivalent.
| Measure | Build | Configure | Consume |
|---|---|---|---|
| Included expenditure | $1.77m | $1.20m | $0.340m |
| Total cash benefits | $0.525m | $0.638m | $0.730m |
| Net cash benefit | −$1.25m | −$0.563m | $0.390m |
| Simple ROI | -70.4% | -46.9% | 115% |
| NPV at 8% real | −$1.09m | −$0.483m | $0.304m |
| Mature annual benefit needed for zero five-year NPV | $0.562m | $0.296m | $0.0715m |
| Discounted payback | Not reached | Not reached | Year 1 |
Consume has the lowest included expenditure and, on these assumptions, achieves positive quantified five-year cash returns. Its $0.304m NPV and 115% simple ROI reflect the short assumed implementation period, low ongoing subscription and full realisation of a $0.150m mature annual benefit; they are not guarantees. A necessary GRC capability may also be justified on security, governance or qualitative grounds beyond a cash-only appraisal.
5. What changes over a longer period?
Years 6–15 hold mature annual costs and benefits constant. This is a scenario extension, not a forecast of product life, pricing, required resources or replacement needs. It excludes major rebuilds, migrations, renewal inflation and changing scope.
| Period | Build | Configure | Consume |
|---|---|---|---|
| 3 years | $1.31m | $0.780m | $0.220m |
| 5 years | $1.77m | $1.20m | $0.340m |
| 10 years | $2.93m | $2.25m | $0.640m |
| 15 years | $4.08m | $3.30m | $0.940m |
Mature annual running costs in the reference model are $0.231m for Build, $0.210m for Configure and $0.0600m for Consume. Their differences reflect the modelled staffing, licence and support assumptions, not universal differences between vendor products.
Longer-term platform ROI
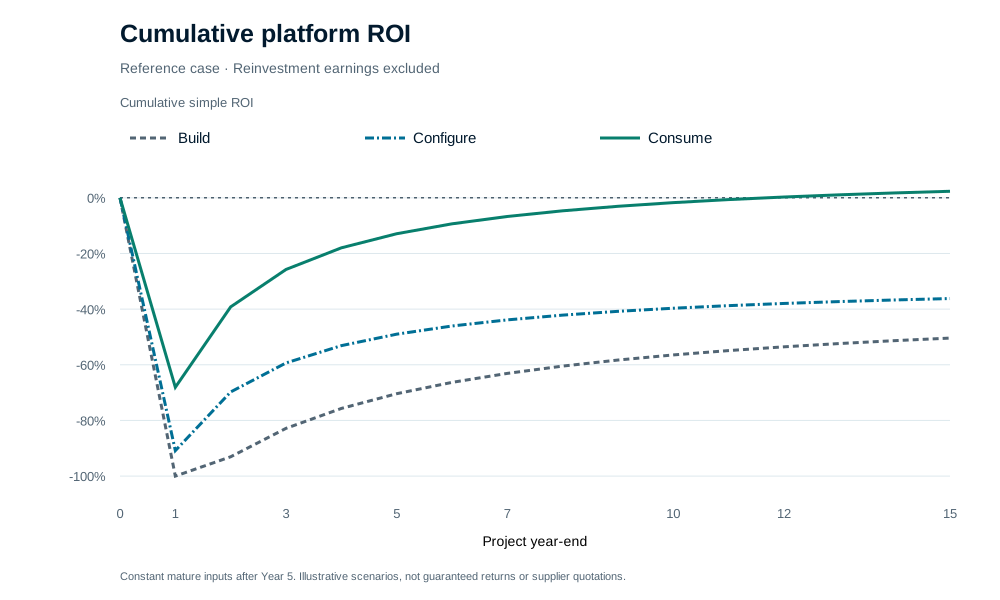
Scroll horizontally to see the full chart.
At Year 15, simple ROI is -50.4% for Build, -35.2% for Configure and 137% for Consume. Consume first reaches simple and discounted payback at Year 1 and Year 1 respectively under the modelled benefit schedule. This should not be read as a guaranteed real-world implementation or payback period.
Operating sensitivities—not reinvestment scenarios
| Operating sensitivity | Build | Configure | Consume |
|---|---|---|---|
| Favourable (costs −20%; benefits +20%) | −$0.711m | −$0.188m | $0.475m |
| Reference (reference inputs) | −$1.09m | −$0.483m | $0.304m |
| Adverse (costs +30%; benefits −20%) | −$1.61m | −$0.875m | $0.105m |
These are five-year NPVs. Only costs and realised cash benefits are varied; go-live assumptions remain unchanged. In the Favourable case, Consume achieves discounted payback at Year 1. This does not result from the separate optimistic reinvestment-return assumption.
Subscription sensitivity
| Configure subscription / Consume subscription | Configure five-year cost | Consume five-year cost |
|---|---|---|
| $0.0800m / $0.100m | $0.850m | $0.540m |
| $0.150m / $0.0600m | $1.20m | $0.340m |
| $0.200m / $0.0500m | $1.45m | $0.290m |
Only subscription prices change in this table; Configure and Consume implementation and support costs remain fixed. The lower- and upper-price cases are sensitivities, not provider quotations. Real deployments may incur additional integrations, specialist support, contractual transition or data-migration costs and may have a different relative cost ranking.
6. Opportunity cost: what else could the organisation do with the money?
An expenditure comparison is incomplete when the choice materially affects another valuable use of capital.
Money committed to GRC delivery may otherwise support product development, additional sales capacity, service improvement, debt reduction or liquidity. The relevant question is what the organisation can realistically achieve with the resources that become available.
Company growth and investment return are not the same measure. Growth depends both on the amount reinvested and the returns earned on that investment. A company’s revenue-growth rate therefore cannot simply be substituted for the return on money released by a technology decision. [4]
Reinvestment scenarios
The analysis uses three explicit assumptions:
| Scenario | Annual real reinvestment return | Interpretation |
|---|---|---|
| OPTIMISTIC | 8% | Stronger assumed return on available capital |
| BASE | 5% | Central modelling assumption |
| PESSIMISTIC | 2% | Lower assumed return on available capital |
These rates are not verified averages for established companies in financial services, legal services, trust and corporate services, or Invenire’s regional markets.
They are annual returns after inflation and before tax, interpreted as net of the incremental operating expenditure needed to earn them. They are not gross revenue-growth assumptions.
The 2% scenario is also not a worst-case boundary. Actual investments can produce no return, lose capital or prevent access to funds when they are needed.
How the comparison works
Build expenditure in each corresponding project year is the baseline. There is no common hypothetical budget and no repetition of Build's first-year development bill in later years.
Annual cash saving = Build cost − alternative cost. Cumulative flat cash savings are the sum of those signed differences from inception through the selected horizon, with no compounding or discounting. Build's incremental saving, reinvestment earnings and advantage are zero—not its expenditure.
Closing advantage = opening advantage × (1 + r) + current year's cash saving. The opening balance contains all prior savings and all prior earnings. New cash enters at year-end and earns returns from the following year. Negative differences are retained; any negative balance carries the same opportunity rate, not a separately estimated borrowing cost.
Cumulative net reinvestment earnings = closing advantage − cumulative cash savings. Operational GRC benefits are not reinvested in this separate cost-comparison analysis. The 2%, 5% and 8% cases hold platform costs at their reference values and do not automatically combine favourable delivery and investment outcomes.
First five years: underlying cash savings
| Project year | Build | Configure | Consume |
|---|---|---|---|
| 1 | $0.000m | $0.300m | $0.560m |
| 2 | $0.000m | $0.211m | $0.361m |
| 3 | $0.000m | $0.0210m | $0.171m |
| 4 | $0.000m | $0.0210m | $0.171m |
| 5 | $0.000m | $0.0210m | $0.171m |
The large first-year expenditure differences do not recur unchanged. Later savings measure Build maintenance and product ownership against the continuing subscriptions and any separately budgeted retained work. The cumulative tables report results from inception, not new savings or investment income generated only in the final year.
7. Cumulative savings and reinvestment value versus Build
All results cover inception through the stated five-, ten- or fifteen-year horizon. Each table uses the same columns: Build, Configure and Consume. Higher values mean a greater incremental financial advantage versus Build, subject to the model boundaries.
Cumulative flat cash savings—before investment returns
| Horizon | Build | Configure | Consume |
|---|---|---|---|
| 5 years | $0.000m | $0.573m | $1.43m |
| 10 years | $0.000m | $0.678m | $2.29m |
| 15 years | $0.000m | $0.783m | $3.14m |
These are cumulative expenditure differences, not platform profits. The alternatives cost less than Build in every modelled year, so their flat savings accumulate before any investment growth. This pattern depends on the chosen cost assumptions and would need reassessment for more complex requirements or higher vendor charges.
Cumulative net reinvestment earnings—cash savings excluded
| Horizon | Scenario / annual return | Build | Configure | Consume |
|---|---|---|---|---|
| 5 years | Optimistic · 8% | $0.000m | $0.168m | $0.338m |
| 5 years | Base · 5% | $0.000m | $0.101m | $0.204m |
| 5 years | Pessimistic · 2% | $0.000m | $0.0389m | $0.0786m |
| 10 years | Optimistic · 8% | $0.000m | $0.534m | $1.32m |
| 10 years | Base · 5% | $0.000m | $0.298m | $0.746m |
| 10 years | Pessimistic · 2% | $0.000m | $0.107m | $0.271m |
| 15 years | Optimistic · 8% | $0.000m | $1.12m | $3.16m |
| 15 years | Base · 5% | $0.000m | $0.579m | $1.67m |
| 15 years | Pessimistic · 2% | $0.000m | $0.193m | $0.572m |
Every monetary cell is earnings accumulated over the whole horizon, including returns on previous earnings. The percentages are annual compounding assumptions. The contributed cash is excluded, so these amounts can be added to the flat savings without double-counting.
Average cumulative total advantage across the three scenarios
Average cumulative advantage = cumulative cash savings + arithmetic mean of cumulative earnings at 2%, 5% and 8%. Each scenario receives equal weight. This is not an annual average or probability-weighted expected return; averaging compounded outcomes differs from compounding at the average rate.
| Horizon | Build | Configure | Consume |
|---|---|---|---|
| 5 years | $0.000m | $0.676m | $1.64m |
| 10 years | $0.000m | $0.991m | $3.07m |
| 15 years | $0.000m | $1.41m | $4.94m |
For Consume at Year 15, cumulative flat savings of $3.14m plus average cumulative reinvestment earnings of $1.80m produce $4.94m average cumulative advantage. The Year 15 balance already includes the first five and ten years; adding those balances again would double-count.
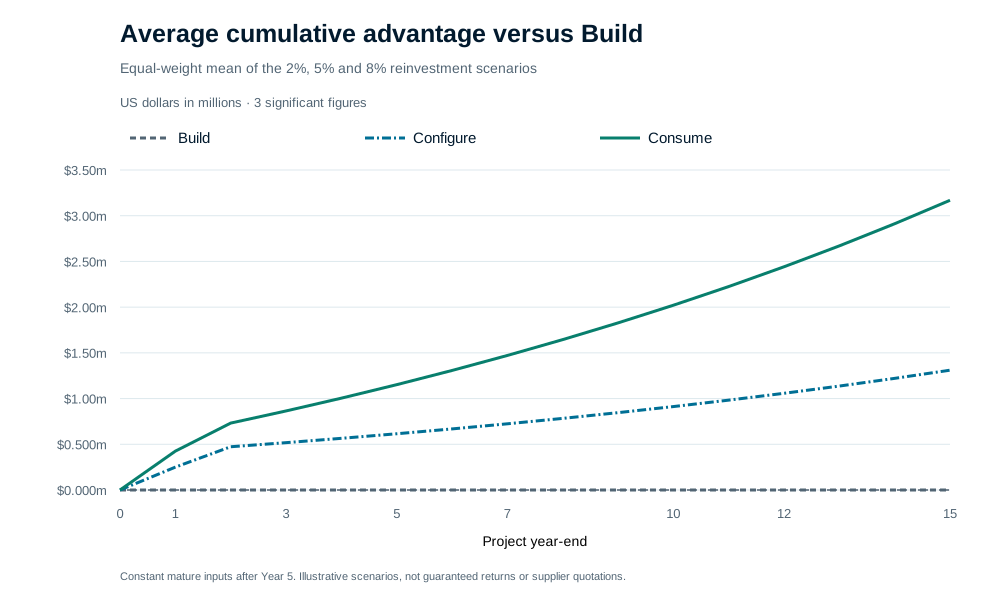
Scroll horizontally to see the full chart.
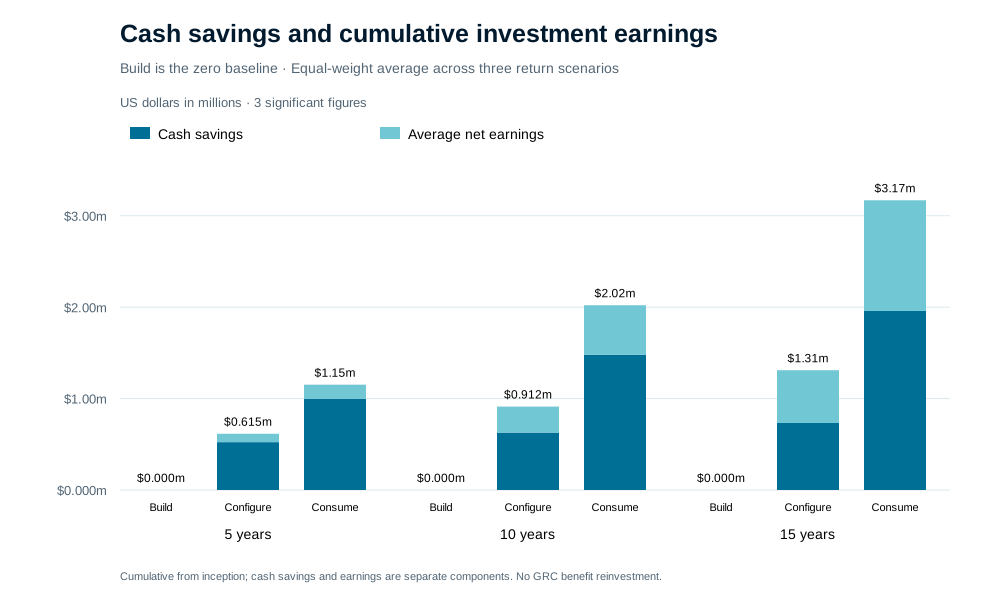
Scroll horizontally to see the full chart.
A relative cost advantage does not establish payback of an entire platform investment. No universal crossover year is inferred beyond the displayed horizon. The long-term findings depend on the assumed maintenance burden, negotiated subscription, actual implementation requirements and whether savings genuinely become investable cash.
8. Avoid overstating the opportunity-cost case
Capital must genuinely become available
A decision that avoids recruiting additional staff may release cash. A decision that reallocates existing employees does not automatically release their salaries.
Redeployed capacity can still create value, but the case should identify the alternative work and its incremental cashflows. It should not count both a salary saving and the benefits of retaining the same employee without reconciling the costs.
The reinvestment tables assume the modelled expenditure differences are genuinely available for alternative use and can be fully reinvested. Where this is not true, the balances overstate the available investment pool.
The alternative activity must be additional
The relevant opportunity is an investment that the GRC choice enables, accelerates or prevents.
If the organisation can fund the same growth project under every option, it should not attribute that project’s entire value to choosing Consume. The assessment should measure what actually changes.
Similarly, additional sales are not equivalent to investment profit. Delivery expenditure, working capital, further investment and other cash requirements must be accounted for.
Do not add future investment balances to NPV
The report uses two different perspectives:
NPV compares platform benefits and costs in present-value terms.
Retained-capital balances show how differences in expenditure could accumulate by a future date.
They cannot simply be added together.
For example, an amount invested today grows by a factor of 1.08 after one year at 8%. Discounted at 8%, it has the same present value as the original amount. Counting both the original saving and the entire future balance would count the principal twice.
A combined business case should instead include each alternative investment’s initial commitment and subsequent incremental cashflows, discounted at a rate appropriate to its risk.
The 5% reinvestment case is a scenario, not a recommendation to approve a project below its required return. If a project has an 8% risk-adjusted hurdle but is expected to earn only 5%, it would not clear that hurdle merely because its funding came from a cheaper GRC option.
Longer horizons need more scrutiny
The ten- and fifteen-year projections isolate the effect of timing and compounding. They do not establish that the same platform, staffing model or contract will remain appropriate throughout that period.
A decision-ready appraisal should explicitly consider major upgrades, platform replacement, security changes, additional integrations, supplier changes, exit and data migration. Leaving those costs out is a limitation, not an assumption that they will never arise.
9. Selected GRC providers: comparison starts with scope
The following examples provide market context. Descriptions summarise provider information checked for the draft; they do not represent independent product testing, exhaustive feature inventories or equivalent service commitments.
| Provider or platform | Publicly described scope | Questions for a comparable proposal |
|---|---|---|
| Archer | Risk, compliance, audit, cyber and third-party risk capabilities. [5] | Which products, environments, implementation services and support arrangements are included? |
| MetricStream | Connected GRC covering risk, compliance, audit and controls, cyber, third-party risk and resilience. [6] | What scope, integrations, configuration effort and ongoing customer resources are required? |
| ServiceNow Integrated Risk Management | Integrated risk-management capabilities within the ServiceNow platform. [7] | What platform entitlements, implementation services and related applications are required for the proposed solution? |
| Optro, formerly AuditBoard | A platform connecting audit, risk, information security and compliance. [8] | Which capabilities, user entitlements, integrations and support services are covered? |
| LogicGate Risk Cloud | A GRC platform with applications, workflow capabilities and integrations. [9] | What application scope, configuration, integration and administration effort is included? |
| Sapere by Invenire Risk | A shared workspace connecting risk information, controls, compliance requirements and reporting. [10] | What software scope, onboarding, support and any separately agreed advisory services are included? |
The commercial questions are suggested procurement questions, not assertions about each provider’s charging model.
None of the financial assumptions in this report should be attributed to the providers listed. The annual Configure subscription of $0.150m and Consume subscription of $0.0600m are illustrative planning inputs, not published prices or quotes for those named products.
Omitted functionality should not be interpreted as absent. Product scope and commercial terms should be confirmed directly with each provider. The table implies no endorsement by the named third-party organisations.
10. A decision framework for leadership
Start with the required outcome
Define essential workflows, assurance requirements and acceptable service levels. Exclude options that cannot meet them before comparing costs.
Compare complete proposals
Use comparable scope and outcomes. For Build, validate skills, architecture, infrastructure and delivery resources; for Configure, identify how bespoke workflows, implementation complexity, licensed users, support and vendor reliance affect cost. For Consume, confirm standard product fit, what the subscription covers, deployment readiness, data access and exit provisions. Include each charge once.
Separate three kinds of value
Distinguish cash savings, productive capacity and risk or strategic benefits. Ownership and flexibility may justify a premium, but require evidence rather than arbitrary financial values.
Make alternative uses explicit
Identify the activity enabled or accelerated by released resources, its funding requirements and incremental returns. Without an identified investment, liquidity may remain valuable, but growth should not be assumed automatically.
Challenge the decision
Test the separate reinvestment, subscription and operating sensitivities. A case dependent on favourable delivery, low support costs and strong investment returns occurring together needs particular scrutiny.
Conclusion
The economics of GRC technology extend beyond the price of obtaining the platform.
An internal build commits delivery and support capacity. A materially tailored commercial platform can avoid bespoke development while retaining its own subscription and configuration workload. A consumed service can preserve capital earlier, while creating a continuing subscription commitment.
In this illustrative reference case, Consume has the lowest included expenditure over five, ten and fifteen years. Its standardised service model also offers an indicative rapid route to value and more predictable vendor-side operational costs, while Build and Configure may provide closer tailoring where required. Exit can be simpler with standardised services but depends on contract provisions, data portability and migration complexity—not merely the delivery label.
That does not establish a universal preference for consumption, nor prove the financial superiority of Sapere or another product. The conclusion depends on comparable outcomes, validated costs, achievable benefits and a credible alternative use of the resources.
Methodology note
Calculations use year-end cashflows, a seven-week Consume go-live assumption, unchanged May 2025 wage observations and an 8% real NPV discount rate. Reinvestment scenarios use 2%, 5% and 8% annual real pre-tax rates; operational GRC benefits are not reinvested. Taxes, financing, terminal values, major replacement programmes, client-specific exit costs and unpriced integration requirements are excluded. Developer and QA employer on-costs are excluded from the reference case. Figures are illustrative and are not supplier quotations.
Sources and methodology references
[1] US Bureau of Labor Statistics. May 2025 national occupational employment and wage estimates: all-industry occupational wage table (opens in a new tab). The report uses software developers at $0.148m and software quality assurance analysts and testers at $0.111m.
[2] US Bureau of Labor Statistics. Occupational Employment and Wage Statistics: frequently asked questions (opens in a new tab). Wage coverage and exclusions; wage estimates are not fully loaded employer costs.
[3] Invenire Risk. Supplied research draft and reviewed illustrative calculation model, October 2026. Retained commercial allowances, staffing quantities, delivery periods and benefit assumptions are editorial inputs, not external market benchmarks. The reproducible model is maintained with the publication source. The salary revisions and 8% / 5% / 2% reinvestment scenarios follow the reviewed draft.
[4] Aswath Damodaran, NYU Stern. Estimating growth (opens in a new tab). Distinguishes reinvestment from the returns earned on investment.
[5] Archer. Public product information (opens in a new tab).
[6] MetricStream. Public product information (opens in a new tab).
[7] ServiceNow. Integrated Risk Management (opens in a new tab).
[8] Optro. AuditBoard to Optro (opens in a new tab).
[9] LogicGate. Risk Cloud platform (opens in a new tab).
[10] Invenire Risk. Sapere platform. Publisher’s own product; commercial interest disclosed above.
[11] LogicGate. Pricing: applications, users, services and scope. Provider pricing (opens in a new tab). Public information does not establish an equivalent quote for every 500–2,500-employee buyer.
[12] Vendr. LogicGate procurement and deployment guidance. Procurement context (opens in a new tab). The discussed ranges are not a matched employee-size cohort, independently tested product comparison or guaranteed tariff.